![]()
![]()
![]()
Use LEFT and RIGHT arrow keys to navigate between flashcards;
Use UP and DOWN arrow keys to flip the card;
H to show hint;
A reads text to speech;
62 Cards in this Set
- Front
- Back
|
Descriptive Statistics |
Summarize a data set into a few numbers that represent or describe a group of numbers. Mean |
|
|
Inferential Statistics |
Compare information from one set of data to another set of data to make a comparison or inference about the data T-test or linear regression |
|
|
Population |
the entire group of items that could possibly be measured Represented by N |
|
|
Sample |
A subset from the population. Should be randomly selected to accurately represent the population Represented by n |
|
|
Variable |
the characteristic you want to measure |
|
|
data |
the values you obtain from a sample population A single value is call a datum |
|
|
data set |
set of variable connected |
|
|
experiment |
a planned activity whose result yield a data set |
|
|
parameter |
a numerical value that summarizes one aspect of the data from a population |
|
|
Statistic |
a numerical value that summarizes one aspect of the data from a sample |
|
|
Qualitative |
Yes/No values pos/neg less than greater than |
|
|
Quantitative |
an actual number |
|
|
Accuracy |
the measurement closest to the true value Inaccuracy: lack of closeness to the true value |
|
|
Precision |
the repeatability of the process how reproducible are your values |
|
|
Inaccuracy and Variability |
Inaccuracy must be detectable and is accepted within it's defined limits variability: is expected and accepted within defined limits
|
|
|
Variability |
We must decide what is acceptable In the lab we test QC and use QC rules to do this |
|
|
Qualitative Data |
Gives a general impression:
|
|
|
Ways to show quantitative data |
|
|
|
Frequency distribution |
|
|
|
Histogram |
|
|
|
Meanm Median, Mode |
In a perfect distribution they should be the same |
|
|
Mean |
add all the numbers divided by the number of data |
|
|
Median |
Middle number Even set of numbers divide by 2 Odd set of number (n+1)/2 Not effected by extreme values |
|
|
Mode |
the number, or numbers, that occur the most frequently Some data is bimodal, sometimes there is no modal number not effected by extreme values |
|
|
Measures of variability- Gaussian distribution |
|
|
|
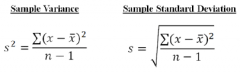
Measures of variability-Standard deviation and variance |
|
|
|
Coefficient of Variation |
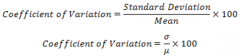
The smaller the CV the better the precision |
|
|
Shift from the mean |
systematic error Can fix |
|
|
5 stages of QC |
|
|
|
Why test QC material |
|
|
|
QC material- Selection and USe |
|
|
|
Assayed control |
QC material that has been repeatedly analyzed by the manufacturer: Includes means and SDs Statistical data is supplied with the QC material Expensive |
|
|
Unassayed controls |
have not been tested for concentration or variability |
|
|
For all controlled material |
The mean and the SD must be verified or established in your lab before use in your QC program QC with different lot # may have different analyte concentrations |
|
|
New lot # |
New mean and SD must be established |
|
|
Minimum QC |
two levels per day for each analyte |
|
|
Frequency of QC testing |
Instrument Manufacturer sets Experience dictates frequency of QC Criticality of the analyte dictates frequency |
|
|
QC levels |
Normal: Ref range Below: the normal/ref range Above: the normal/ref range |
|
|
QC level 1 |
usually in the "normal/ref range" |
|
|
QC level 2 |
usually in the abnormal range ( some high some low) |
|
|
QC level 3 |
Low abnormal, normal, and high abnormal- used in hematology for drug testing |
|
|
Evaluation of QC data |
Based on Gaussian Curve:
|
|
|
Levey-Jennings Chart |
|
|
|
Creating a Levey-Jennings Chart |
|
|
|
Analytic Errors |
|
|
|
Random Errors |
|
|
|
Systemic Error |
|
|
|
Gaussian distribution |
|
|
|
Shift |
|
|
|
Trend |
|
|
|
Shift/Bias |
The QC data shifts/move abruptly away from the mean for number of days |
|
|
Trend |
QC data either decreases or increases consistently over a period of 7 days |
|
|
Westgard QC multi-rules |
IDs the presence of:
|
|
|
One (1) QC warning rule |
gets your attention |
|
|
Five (5) QC failure rules |
used to reject qc data: 5 rules are applied if 2 QC levels are used, other rules exist if 3 qc levels are used |
|
|
Why repeat QC with a 13s QC error |
|
|
|
Why troubleshoot QC with a 22s error |
|
|
|
Troubleshoot QC Systemic error |
|
|
|
41s error |
|
|
|
10x failure rule |
|
|
|
Look at QC rules when |
QC violates the 1-2s warning rule, look at QC data continually |
|
|
Common mistakes in use of QC |
|