![]()
![]()
![]()
Use LEFT and RIGHT arrow keys to navigate between flashcards;
Use UP and DOWN arrow keys to flip the card;
H to show hint;
A reads text to speech;
19 Cards in this Set
- Front
- Back
|
Three levels of biodiversity |
Genetic diversity Species Ecosystem or habitat |
|
|
Genetic diversity |
Diversity if Gene's in each species and individual which is the source of their unique features |
|
|
Species diversity |
Diversity of living organisms, number of species |
|
|
Ecosystem or habitat diversity |
Different types of communities or organisms, their environment and interaction between them I.e. forest, river, estuary, mangrove, coral reef etc. |
|
|
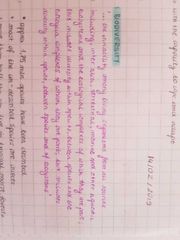
Biodiversity |

|
|
|
Species |
A group of individuals that doesn't normally breed with individuals outside it's own group |
|
|
How do species differ |
Different genomes - compliment of genes define a large part of the structure and functioning of an organism Characteristics not completely determined by genes- environment is also important |
|
|
Measuring biodiversity |
Species richness - no of different spp in a particular area Species evenness - relative abundance of a given species in an area Species diversity - species no (richness) weighted by measure of importance such as abundance |
|
|
Simpson's Index of Diversity |
0-1, the higher the D the lower the biodiversity Often presented as 1-D cause easier to understand It emphasises species abundance Assumes all species are of equal importance (no weight for rare, endemic species) Does not say anything about changes in community structure |
|
|
Measures of abundance |
Percentage cover - the proportion of each quadrat occupied by the species Population density - the number of individuals per quadrat Species frequency - the proportion of quadrants with the species in it |
|
|
Species around the world |
1.75 million species have been described Most of the undescribed are insects More than half of the species live in tropical moist forests (6% of land surface) |
|
|
Extinction |
Exponential growth in loss rates since Xvii C 100 000 species lost per year Clearly there have been large extinction events throughout time but humans increasingly playing a role |
|
|
Centres of diversity in Africa |
Eastern Arc forests in central-eastern Tanzania - 33% of 1600 are endemic The Cape in South Africa - 73% of 8600 species are endemic Madagascar - 80% of 8500 species are endemic |
|
|
Why measure biodiversity |
A diverse, specie rich habitat is believed to be able to withstand environmental impact. A habitat low in species may be less able to resist and recover from environmental impact Monitor changes in the environment |
|
|
Indirect drivers of biodiversity loss |
Economic Demographic Socio-politics Cultural & religious Science and technology |
|
|
Direct drivers |
Habit change Climate change Invasive species Over-exploitation Nutrients and pollution |
|
|
Habitat change |
Loss, degradation, formation Deforestation, land conversion for agriculture, urbanization Fragmentation increases the edge making interior habitat and species decrease and edge habitat and species increase |
|
|
Invasive species |
Not all exotics are invasive To be invasive a species must easily adapt to a new area, reproduce quickly and harm native plants or animals, property or the economy |
|
|
Intervention for biodiversity conservation |
Protection of areas Abatement measures Restoration Sustainable use |

