Reading...
![]()
Play button
![]()
Play button
![]()
Use LEFT and RIGHT arrow keys to navigate between flashcards;
Use UP and DOWN arrow keys to flip the card;
H to show hint;
A reads text to speech;
29 Cards in this Set
- Front
- Back
|
Describe selection bias.
|

Different criteria for cases vs controls.
|
|
|
Describe observational bias
|
Info on disease outcome obtained in a noon-comparable manner btwn exposed & unexposed.
|
|
|
Describe confounding bias.
|
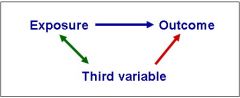
Failure to take into account other variables associated with both disease & the exposure. i.e. smoking
|
|
|
Describe case-control studies
|

Retrospective. Identify a group of workers w/ disease & examine their work history for potential exposures.
|
|
|
Describe cohort studies
|

Prospective. Identify a workers by exposure, watch for disease (most powerful)
Retrospective cohort: go back in time and Identify people by exposure and follow them to the present time looking fir the development of a disease. |
|
|
Incidence Rate
|
Number of new cases of a disease per worker per unit time.
Focused only on new cases |
|
|
Prevalence Rate
|
Total number of cases in a worker population at a specfic time.
|
|
|
Relative Risk
|
Comparison of disease prevalence between exposed and unexposed worker population.
|
|
|
Attributable Risk
|
Difference in risk between and exposed group and an unexposed group
|
|
|
Odds Ratio
|
Comparison of the odds of getting a diease in an exposed group to the odds of getting a disease in an unexposed group.
|
|
|
Case Control Study
Prospective or retrospective? Cases are identified from ? How are controls selected? Cases and controls compare what? End results is ? |
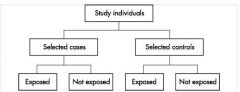
Case Control Study
Retrospective- looking at people who already have disease Cases are identified from a specific population. Controls are people from same population that do not have disease. Compare exposure btwn cases and controls. End result is an odds ratio. |
|
|
What results is given in a case control study
|
odds ratio
|
|
|
Cohort Study
Prospective or retrospective? How are cohort studies structured? |
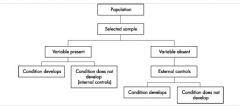
Cohort Study
Prospective. Identify a population prospectively and follow them over time. Measure exposure and disease over time. Most power type of study other than clinical trials. |
|
|
What study is the most powerful type other than clinical trials?
|
Cohort studies
|
|
|
Cross-Sectional Study
Population based on? How and when are disease and exposure measure over time? AKA? |
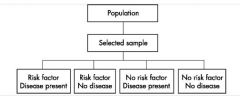
Cross-Sectional Study
Study of population regardless of exposure or disease status. Take a cross-section of population. Diease and exposure measured at the same time. AKA - prevalence study |
|
|
Mortality Studies
Comparison of ? What is SMR? An SMR of 100 = ? Incorrect to compare SMR across? |
Compare mortality rate of a population relative to the standard population.
SMR: standard mortality rate SMR = 100 indicates no relationship |
|
|
A study followed a group of electrical utility workers over time. The researchers studied their exposure to EMF and the development of prostate cancer. What type of study is this?
|

Cohort study
|
|
|
What is the null hypothesis?
|
The null hypothesis is the belief that no exposure:disease relationship exists.
Often states Ho: - Smoking is not associated with lung cancer. -Benzene is not asssociated with leukemia. |
|
|
What is the alternate hypothesis?
|
The alternate hypothesis is that there IS an exposure:disease relationship.
Often stated H1 or Ha: -Smoking is associated with lung cancer. |
|
|
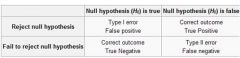
Type 1 error
|
Rejection of the null hypothesis when the null hypothesis is true.
-Believing there is a disease exposure relationship when no relationship exists. |
|
|
Type II error
|

Accepting the null hypothesis when the null hypothesis is not true.
|
|
|
Which type of error?
Smoking is not associated w cancer? |
Type II error.
Accepting the null hypothesis when the null hypothesis is not true. |
|
|
Which type of error?
Saccharin is a human carcinogen |

Type I error.
Rejection of the null hypothesis when the null is true. (Believing there is a diease exposure relationship when no relationship exists) |
|
|
Which typeof error?
Ethanol consumption is not associated with liver disease? |
Type II error.
Accepting the null hypothesis when the null hypothesis is not true. |
|
|
Alpha (α)
Beta (β) |
α = the probability of making a random type I error.
β = probability of committing type II error. |
|
|
α = ?
Confidence = ? |
α is probably of a random type 1 error.
α = 0.05 Confidence = 1 - α Typically 95% |
|
|
p-value
p-value is the probably of ? |
p-value is the probably of committing a random type 1 error.
If p-value < α, then results is declared statistically significant. |
|
|
Beta (β) is the probably of ?
|
β is the probably of committing type II error.
Power of test = 1 - β |
|
|
Confidence Interval
Results from test relying on statistical methods are reported with a confidence intervale. RR and OR are reported with an interval. If the interval includes 1, then ? If the interval does not include 1, then? |
If the interval includes 1, then it is NOT statistically signficant. Eg. (0.62, 1.18)
If the interval does not include 1, then it IS statistically significant. E.g. (2.69, 5.05) |