Reading...
![]()
Play button
![]()
Play button
![]()
Use LEFT and RIGHT arrow keys to navigate between flashcards;
Use UP and DOWN arrow keys to flip the card;
H to show hint;
A reads text to speech;
20 Cards in this Set
- Front
- Back
|
Using Genetic Variation (3 strategies)
|
3 strategies to exploit genetic variation:
(1) Selection among breeds (2) Crossbreeding (3) Selection w/in a breed |
|
|
Response to Selection for a Single Trait, Depends on 5 Factors;
(aka Five Factors that influence a selective breeding program) |
(1) Generation Interval
(2) Variation in Breeding Values (3) Intensity of Selection (4) Effective Population Size (5) Accuracy of Selection |
|
|
Generation Interval (L)
|
The average age of parents when offspring are born. It is calculated separately for the males and females, then averaged (to get flock generation interval).
--> Another way of thinking about the generation interval is the speed with which each generation is replaced (ideally with genetically superior animals). The shorter the generation interval, the faster the rate of genetic progress per year resulting from selection. There is generally a TRADE OFF between generation interval and selection intensity. EXAMPLE: If you want to reduce the generation interval, you might select a large proportion of that years crop of ewe lambs, however there is little selection on those ewe lambs. Conversely, if you pick the top 10% of ewe lambs for replacements, that is high selection intensity, but less effective to reduce generation interval. |
|
|
Calculating Generation interval
|
(1) Proportion of age (decimal) x animal age = WEIGHTED AGE
(2) Add all the weighted ages together, get the generation interval for that group (males, or females). (3) Average the ewe & ram generation intervals to get flock generation interval |
|
|
Sample Male Generation Interval Calculation
|
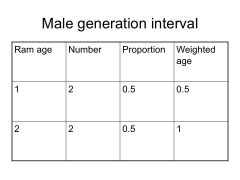
(A) Information you require: Ram ages, & # of each age
(B) To calculate: Proportions of ages (decimal value) & Weighted ages (age x proportion) (C) Sum of weighted ages = male generation interval (Using data in table...) Male generation interval = 1.5 years |
|
|
Sample Female Generation Interval Calculation
|
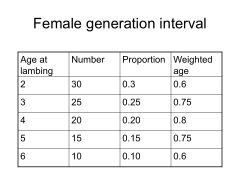
(A) Information required: Ewe ages, & # of each age
(B) To calculate: Relative proportions of ages (decimal) & weighted ages (age x proportion) (C) Sum of weighted age = female generation interval (From data...) Female generation interval = 3.5 years |
|
|
Sample Flock Generation Interval Calculation
|
After solving for male & female generation intervals, the flock generation interval can be calculated (sum of male and female generation intervals)
Ram Generation interval = 1.5 Ewe Generation interval = 3.5 FLOCK GENERATION INTERVAL = 2.5 years |
|
|
Variation in breeding values (VA)
|
The basic material on which selection acts. Variation depends on (1) Phenotypic variation, and (2) Heritability. Greater variation gives an improved response for the same intensity of selection.
Selecting the top 20% of bulls on breeding values for milk yield... (A) With SMALL variation in breeding values = may result in daughter population producing 70 liters above mean. (B) With LARGE variation in breeding values = may result in daughter population producing 140 liters above mean. |
|
|
Selection Intensity
|
The superiority of the selected parents standardized according to the amount of variation in the trait.
If we select and breed the top 10% for any character/trait, there will be a greater improvement than selecting the top 90% for any given character/trait. Selection intensity in practice is LIMITED BY (1) reproductive ability, and by (2) facilities for raising offspring. Any technique that improves reproductive rate, if properly used can increase selection intensity. |
|
|
Selection intensity (i) Equation
|
Selection intensity (i), can be expressed in standard deviations; it equals the selection differential divided by phenotypic standard deviation.
i = S / σ p S = Selection Differential; the difference in mean trait between the population as a whole and the selected parents of the next generation σp = Standard Deviation (variation from average) of Phenotypic observations. |
|
|
Effective Population Size (Ne)
|
The population size taking into effect that not all members of a population have equal chance of contributing gametes to the next generation. (An estimated number of the sexually reproducing individuals.)
Factors that influence Ne = (1) sex ratios, (2) family sizes (lifetime production of offspring per individual) (3) temporal variation (variation of population #'s over time) For example; (a) For farm animals, the differences in relative contribution of males and females can be important. (b) In a stable population, each family contributes 1 male and 1 female as parents of the next generation. When all families contribute alleles equally to the next generation, there is minimal distortion in allele frequencies and the proportion of the genetic diversity passed on is maximized. Conversely, fluctuations/or the higher variance in family size, the lower the effective population size. (c) Populations can vary in size between generations. |
|
|
Effective Population Size: Adjusting for sex ratios.
|
For unequal numbers of breeding males and females in a population, a suitable adjustment (for estimating effective population size) is given by the equation:
4sd / (s+d) s = number of sires entering population each generation d = number of dams entering population each generation |
|
|
Effective Population Size: Inbreeding & Genetic Drift
|
If the effective population size is small, then INBREEDING & GENETIC DRIFT can reduce selective improvement.
|
|
|
Inbreeding
|
(a) Defined as the mating of related animals; when parents share a common ancestor.
(b) It increases HOMOZYGOSITY (c) Increases FREQUENCY of harmful homozygous recessive genes; which is one of the causes of INBREEDING DEPRESSION (reduced performance) --> Avoid mating animals with more than 1/16 of their genes in common (individuals with one common grandparent) |
|
|
Significance of Inbreeding
|
(1) INBREEDING DEPRESSION; reduced performance, particularly in traits related to fertility and survival (observed in partially inbred populations)
(2) Increased homozygosity exposes deleterious recessives; this increased frequency of deleterious recessives is one of causes of inbreeding depression. (3) Loss of FAVORABLE INTERACTIONS among and within loci EXAMPLE: If too intensively breed one bull b/c such high/superior breeding values/genetics, run the risk of bringing out deleterious recessive gene = inevitable consequence of inbreeding. |
|
|
Avoiding Inbreeding
|
Avoid matings closer than grandaughter-grandson.
--> On average, grandchildren w/ one grandparent in common have 1/16th genes in common. |
|
|
Genetic Drift
|
(a) Random variation in gene frequencies due to chance.
(b) Can result in loss of favorable alleles (good genes involved in selection may be lost) --> CONSEQUENTLY, the response to selection is decreased. (c) Occurs especially when frequency of a gene is low, or when the population consists of few individuals. (It is therefore important in small populations; w/ conservation biology). |
|
|
Accuracy of Selection
|
The correlation between true and estimated breeding value. (How accurately breeding values can be estimated)
Depends on (3 factors): (1) Heritability (2) Number and similarity of measurements (3) Relatives and genetic relationship (may depend on how distant the genetic relationship is) |
|
|
Accuracy of Selection; EQUATION
|
For a single measurement on a candidate; Accuracy of Selection = square root of the heritability ( h^2) = h
--> Accuracy can be increased by taking multiple measurements when possible, or by using records on relatives. |
|
|
Breeder's Equation: Estimating Breeding Values (a.k.a Response to Selection)
|
Response to Selection = heritability x selection interval
R = h^2 x S Can break down... Response to selection = (variation in breeding values / variation in phenotype) selection intensity x phenotypic standard deviation R = (σ^2 a / σ^2 p) i σp Simplified... Response to Selection = standard variation of breeding values x accuracy of selection x selection intensity R = σa h i --> This equation assumes large populations size & is measured in generations |