![]()
![]()
![]()
Use LEFT and RIGHT arrow keys to navigate between flashcards;
Use UP and DOWN arrow keys to flip the card;
H to show hint;
A reads text to speech;
91 Cards in this Set
- Front
- Back
|
What is the population? |
All individuals of interest |
|
|
What is a sample? |
The individuals studied. |
|
|
List three problems with using the number 868/1523 (obtained from a Gallup poll) for the probability that all adults bought a lottery ticket last year. _____, might be a bad sample, people might lie or forget |
only a sample |
|
|
List three problems with using the number 868/1523 (obtained from a Gallup poll) for the probability that all adults bought a lottery ticket last year._____, only a sample, people might lie or forget |
might be a bad sample |
|
|
List three problems with using the number 868/1523 (obtained from a Gallup poll) for the probability that all adults bought a lottery ticket last year. ______, only a sample, might be a bad sample. |
people might lie or forget |
|
|
If the sample size in the Gallup poll went from 1523 to 6523 will the percentage that said they bought a lottery ticket most likely go up, most likely go down, or can you not tell? |
can’t tell |
|
|
If you take two samples of the same size from the same population will the percentage that bought a lottery ticket be the same? |
probably not |
|
|
Which is likely to be closer? The percentages in two samples of size 5 from the same population, or the percentages in two samples of size 500 from the same population? |
500 |
|
|
In a discrete probability model all the probabilities of all the outcomes add up to what number? |
1 |
|
|
In a continuous probability model what adds up to 1? |
total area |
|
|
Three ways of determining probability are ________, theory, and guess. |
experiment |
|
|
Three ways of determining probability are ________, experiment, and guess. |
theory |
|
|
Three ways of determining probability are ________, theory, and experiment. |
guess |
|
|
If someone gives you a coin, can you find exactly the probability it will land heads? |
no |
|
|
Suppose I give you a bent coin, how can you estimate the probability it will land heads? |
toss it many times (experiment!) |
|
|
Chance behavior has what property in the short run? |
unpredictable |
|
|
Chance behavior has what property in the long run? |
predictable |
|
|
When observing, do people tend to see the long run? |
no |
|
|
When observing, do people tend to give equal importance to all outcomes? |
no |
|
|
When observing, which outcomes do people tend to give more importance to? |
remarkable ones |
|
|
Suppose airline A has three times as many flights out of a city than airline B which will have a higher percent of delayed flights? Most likely A, most likely B or you have no idea. |
no idea |
|
|
What is the notation for the population mean? |
|
|
|
The variance and standard deviation measure what? |
how the data is spread out |
|
|
The mean measures what? |
the middle of the data |
|
|
What is the notation for population variance? |
|
|
|
What is the notation for population standard deviation? |
|
|
|
What is the area under the z curve? |
1 |
|
|
What is the mean of the z curve? |
0 |
|
|
What is the standard deviation of the z curve? |
1 |
|
|
What is the formula for the z curve? |
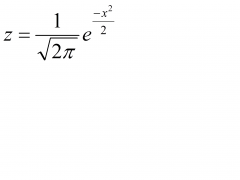
|
|
|
Describe how far a standard deviation is on the z curve. |
horizontal distance from the top to where the slope is getting less steep instead of steeper |
|
|
On the z curve how much of the data is within 1 standard deviation of the mean? |
about 68% |
|
|
On the z curve how much of the data is within 2 standard deviations of the mean? |
about 95% |
|
|
On the z curve how much of the data is within 3 standard deviations of the mean? |
about 99.7% |
|
|
For any probability distribution how much of the data is within 1 standard deviation of the mean? |
can’t say anything |
|
|
For any probability distribution how much of the data is within 2 standard deviations of the mean? |
at least 75% |
|
|
For any probability distribution how much of the data is within 3 standard deviations of the mean? |
at least 88.8% |
|
|
What is a parameter? |
number that describes the population |
|
|
What is a statistic? |
number that describes a sample |
|
|
Most often what is calculated, a parameter or a statistic? |
statistic |
|
|
What is the notation for the sample mean? |

|
|
|
What is the notation for the sample standard deviation? |
|
|
|
What is the notation for the sample variance? |
|
|
|
|
|
|

|
|
|
large |
|
|
If you flip a fair coin and record the percentage of heads, you will get close to 50% by luck and __________. |
large sample size |
|
|
If you flip a fair coin and record the percentage of heads, you will get close to 50% by _____ and having a large sample size. |
luck |
|
|
If you flip a fair coin 10 times and get close to 50% it will be mostly due to what? |
luck |
|
|
If you flip a fair coin 1000 times and get close to 50% it will be mostly due to what? |
large sample size |
|
|
|
|
|
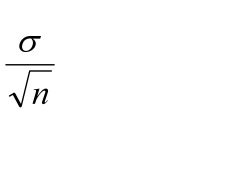
|
|
|
For large samples is there much difference between sampling with and without replacement. |
no |
|
|
If the original data is normal, what about the shape of all sample means from samples of the same size? |
normal |
|
|
If the original data is not normal, what happens to the shape of all sample means from samples of size n as n goes up? |
gets closer to normal |
|
|
What is the name of the theorem that says as the sample size goes up that the sample means become closer to normal? |
Central Limit Theorem |
|
|
Consider data setsA:{25,26,26,25,24} and B:{15,25,38,22,40}. If you know one set of data is 5 individuals and the other is 5averages, which is more likely to be the 5 averages? _____. |
A |
|
|
Consider data setsA:{25,26,26,25,24} and B:{15,25,38,22,40}. If you know one set of data is 5 individuals and the other is 5averages, A is more likely to be the 5 averages? This is because the ___________ __________of averages is smaller. |
standard deviation |
|
|
Consider data setsA:{25,26,26,25,24} and B:{15,25,38,22,40}. If you know one set of data is 5 individuals and the other is 5averages, A is more likely to be the 5 averages? This is because the standard deviation ofaverages is _________. |
smaller |
|
|
Explain why it makes sense that averages tend to have a smaller standard deviation than individuals? |
highs and lows tend to cancel out |
|
|
|
|
|
|
|
|
smaller |
|
|
What does the z score tell us in terms of standard deviation? |
how many standard deviations from the mean |
|
|
Is it human nature to tend to pay more attention to anecdotes or all the data? |
anecdotes |
|
|
Which is more important to pay attention to, anecdotes or all the data? |
all the data |
|
|
Give an example of how data beat anecdotes. |
looking at all the data about child and leukemia and power lines instead of news interview of one mother with child with leukemia that happens to live near a power a line |
|
|
What is a lurking variable? |
a variable that affects the variables you are interested in but is not mentioned |
|
|
Give an example of lurking variable. |
child in soccer have higher school scores, but a LV is how much the parents want their kids to succeed, if they want their kids to succeed a lot then they will be more likely to put them in soccer and also do things such as to encourage them to study |
|
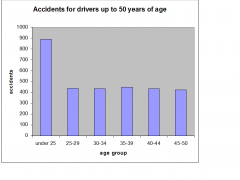
Why does the following graph make it look likedrivers under 25 are the worst? |
the under 25 has a lot more drivers |
|
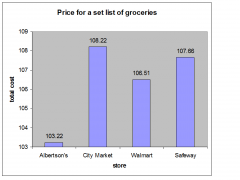
Two problems with the graph are the y-axis startat 0 and ____________. |
we don’t know how the data was obtained |
|

Two problems with the graph are we don’t how thedata were obtained and _______. |
the y-axis does not start at 0 |
|
|
Why do we do statistical graphs? |
to understand the data |
|
|
Let’s compare percent of children abused in Idaho and Virginia. In Idaho its 22.6% and in Virginia its only 5.9%. Does this mean it is safer for children in Virginia? Explain. |
no, definition of child abuse could be different |
|
|
How is it that in 1998 North Dakota that was 45th in spending per pupil has a much higher SAT average (by almost 200 points) than New Jersey that was 2nd in spending per pupil? |
mostly the best students in North Dakota take the SAT while in New Jersey a much higher percent take the SAT |
|
|
Suppose in a big city it is found that in all fatal car accidents 25% were under the influence of alcohol and 75% were not. It seems that it is better to be drunk, explain why it is not the case. |
there are many more drivers not drinking so they could easily have more accidents |
|
|
Are statistical conclusions about populationsbased on samples ever 100% sure? |
no |
|
|
A good graph will show that many people mostlikely in Florida voted for whom by mistake in 2000? |
Buchanan |
|
|
In a CI as the confidence level goes up, what happens to the margin of error? |
up |
|
|
In a CI as the sample size goes up, what happens to the margin of error? |
down |
|
|
In a CI if the standard deviation gets higher, what happens to the margin of error? |
up |
|
|
All things being equal, do we prefer the margin of error to be big or small? |
small |
|
|
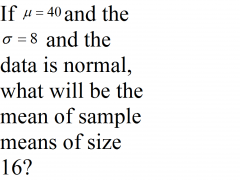
40 |
|
|
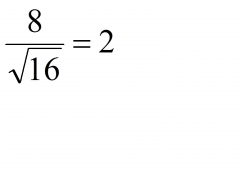
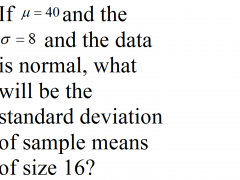
|
|
|
normal |
|
|
Is the z distribution symmetric? |
yes |
|
|
Is the mean sensitive to outliers? |
yes |
|
|
Is the standard deviation sensitive to outliers? |
yes |
|
|
Is the median sensitive to outliers? |
no |
|
|
Are the quartiles sensitive to outliers? |
no |
|
|
Suppose you have data only summarized in different numerical ranges. How can you estimate the mean and standard deviation? |
assume the data are the midpoints of the ranges |