![]()
![]()
![]()
Use LEFT and RIGHT arrow keys to navigate between flashcards;
Use UP and DOWN arrow keys to flip the card;
H to show hint;
A reads text to speech;
63 Cards in this Set
- Front
- Back
|
Inputs |
exchanges from surrounding environment into the ecosystem |
|
|
Outputs |
exchanges from inside the ecosystem to the surrounding environment |
|
|
Closed ecosystem |
no inputs Bog |
|
|
Open ecosystem |
recieves inputs Stream most are this |
|
|
First law of thermodynamics |
All energy is constant and cannot be created or destroyed, only change form |
|
|
Second law of thermodynamics |
When energy is transferred or transformed, part of it assumes a form that cannot pass on any further
|
|
|
Entropy |
the reduction in potential energy |
|
|
Living systems |
open systems, sun provides constant input of energy, counteracting entropy |
|
|
Exothermics |
reaction losses energy release heat |
|
|
Endothermic |
reaction absorbs energy absorbs heat |
|
|
Potential energy |
energy of position |
|
|
Kinetic energy |
energy of motion |
|
|
Chemical energy |
potential energy held in the bonds between atoms |
|
|
Photosynthesis |
autotrophs or primary producers produce food, fix carbon CO2 + H2O + Sun => C6H12O6 + 6O2 |
|
|
Cellular Respiration |
Heterotrophs Release chemical energy Organisms use chemical energy stored during photosynthesis O2 used to convert C6H12O6 => H2O +CO2 + Energy |
|
|
Gross Primary Production (GPP) |
Assimilation of energy by autotrophs
|
|
|
Net Primary Production (NPP) |
Energy remaining after respiration and used to generate biomass available for heterotrophs |
|
|
Energy Fixing not dependent on the sun |
bacteria used in chemical energy fixation near hydrothermal vents |
|
|
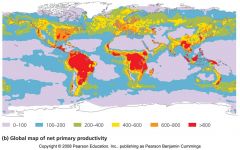
Productivity |
rate at which organic matter is created by photosynthesis |
|
|
Biomass |
amount of organic matter present at any given time |
|
|
Units of productivity |
Energy/area/time = kcal/m2/yr Mass of OM/area/time = g/m2/yr |
|
|
Standing Crop Biomass |
Grams of accumulated OM in a given area at a given time = mass of OM/area = g/m2 |
|
|
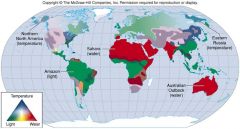
NPP increases with increasing temp and precip on land and light and nutrients in aq systems |
|
|
Climate determines NPP Closer to the equator, longer growing season Lack of water lowers PP |
|
|
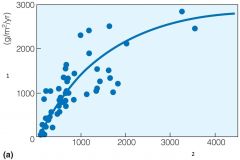
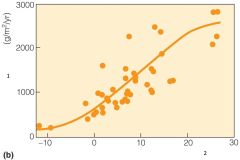
1. Dry matter production 2. Precipitation |
|
|
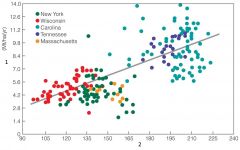
1. NPP 2. Length of photosynthetic period (days) |
|
|
1. Dry matter productivity 2. Temperature °C |
|
|
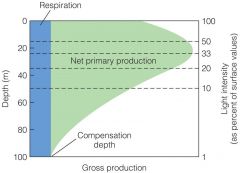
Light and nutrient availability limit PP in ocean Light decreases with depth |
|
|
Compensation depth |
depth where photosynthesis and respiration balance out |
|
|
Macronutrients |
nutrients required in relative large amounts NPC |
|
|
Micronutrients |
nutrients needed in smaller amounts |
|
|
Limiting nutrients in aquatic systems |
N or P sometimes Fe |
|
|
Redfield ratio |
ratio of C to N to P for plants 106:16:1 |
|
|
Autochthonous |
OC produced within system |
|
|
Allochthonous |
OC produced outside of the system |
|
|
Plant energy allocation and PP |
Energy put into leaf production increases PP Energy put into stem and root decreases PP |
|
|
High NPP |
Ecosystems whose plants rapidly convert solar energy into biomass |
|
|
Secondary production |
Heterotrophs consume primary producers some energy lost as heat energy used to maintain body systems left over energy used for growth and reproduction |
|
|
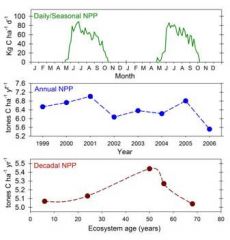
Daily, seasonal, years variations in NPP |
|
|
High secondary productivity |
Birthrate of population and growth rate of individual is highest |
|
|
PP limits SP |
All PP is consumed by grazers or decomposers |
|
|
PP available to SP varies |
Grasslands vs forests easily accessible to grazers vs only woody biomass within reach |
|
|
Assimilation |
Converting PP into SP |
|
|
Assimilation efficiency |
ratio of assimilation to ingestion |
|
|
Production efficiency |
ratio of production to assimilation |
|
|
Variations in assimilation efficiency
|
Endotherms > ectotherms Carnivores (80%) > herbivores (20-40%) |
|
|
Variations in producition efficiency |
Invertibrates (30-40%) Ectothermic vertebrates (10%) Endothermic vertebrates (1-2%) |
|
|
Body size of endotherms and production efficiency
|
Larger = higher prodction efficiency SA/V |
|
|
Production rates affected by |
quality of food feeding strategy energy spent acquiring food |
|
|
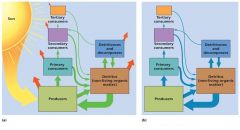
(a) Energy flow (b) Matter cycling |
|
|
Types of food chains |
Grazing Detrital |
|
|
Grazing food chain |
Primary producers eaten directly by grazers |
|
|
Detrital food chain |
Primary producers broken down by decompsers and detritus feeds comsumers |
|
|
Primary Consumers (Grazing) |
Second trophic level Herbivores |
|
|
Secondary Consumers (Grazing) |
Third trophic level Carnivores |
|
|
Tertiary Consumers |
Forth trophic level predators at the highest trophic level consume secondary consumers |
|
|
Omnivores |
consumers that eat both plants and animals |
|
|
Detritivores |
scavenge waste products or dead bodies (detritus) Millipedes Fiddler crabs |
|
|
Decomposers |
Break down leaf litter and other non-living material enhancing topsoil and recycling nutrients Fungi, bacteria |
|
|
Consumption efficiency |
Consumption ratio of ingestion to production at the next trophic level Production in one trophic level limits the production in the level above it |
|
|
Available energy and food chains |
Decreases up the food chain, less energy availabl in each trophic level Each level contains 10% of the energy of the trophic level below it |
|
|
Top Predators |
Rare, constrained by lack of energy at the top of the food web |
|
|
NPP and trophic levels |
NPP controls higher trophic levels and vice versa grazing and predators |