![]()
![]()
![]()
Use LEFT and RIGHT arrow keys to navigate between flashcards;
Use UP and DOWN arrow keys to flip the card;
H to show hint;
A reads text to speech;
33 Cards in this Set
- Front
- Back
|
four risk ASSESSMENT paradigms |
1. hazard ID 2. dose response 3. exposure assessment 4. risk characterization |
|
|
three risk ANALYSIS paradigms |
1. risk assessment 2. risk management 3. risk communication |
|
|
How do we deal with uncertainty? |
fitting a curve reduces uncertainty |
|
|
Bootstrapping |
takes data points from the simulation distribution/combined variables to plot a new curve less uncertainty as a result |
|
|
IRIS(integrated Risk Information Systems) |
Identifies and characterizes health hazards of chemicals found in the environment |
|
|
QMRA Wiki |
you get microbial data from this |
|
|
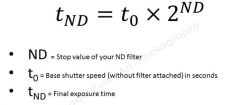
time of exposure formula |
|
|
|
four exposure routes |
1. inhilation 2. skin absorption 3. ingestion 4. injection |
|
|
which step in risk assessment has the greatest uncertainty? |
Exposure assessment |
|
|
Paloma and reynolds reading |
probability of infection from enteric and respiratory viruses in a workplace setting. uses monte carlo simulation Healthy workplace project (HWP) |
|
|
Reynolds reading |
study on laundry and reduction/transfer of bacteria and viruses. drying kills most bacteria. uncertainties: -who was using the products -not knowing how people use them -uncertainty in experimental data and fit model -some people use a lot, some didn't |
|
|
Stochiastic variables |
randomly distributed |
|
|
deterministic variables |
uses mean values of the risk. gives a lot of uncertainty since you are overestimating the people with lower values mean value= worse value |
|
|
exposure duration (child vs. adult) |
adult has a longer exposure duration than a child |
|
|
why is body weight important with chemicals and not in microbial infections? |
body weight does not matter in microbial infections because a singular microbe can cause an infection less body weight= more concentrated chemicals adults have more space to "dilute" a chemical infection |
|
|
chemical modeling |
utilizes RfD and slope factors |
|
|
Microbial modeling |
utilizes poisson models and alpha/ beta |
|
|
RfD |
non carcinogenic; estimation of daily intake over a lifetime =NOAEL/UF |
|
|
slope factors |
carcinogens;represent potency of medications |
|
|
exposure handbook |
statistical data on various factors use in assessing human exposure |
|
|
Probabilistic |
based on or adapted to a theory of probability; subject to or involving chance variation |
|
|
Point estimates |
single exposure risk EX: anthrax (1 spore inhaled) exponential dose response:1-exp(-dose x r) EX: cryptosporidium in water |
|
|
Independence model |
each event is discrete risk of any other exposure is statistically independent |
|
|
Dose accumulation model |
individual doses are additive interactions may be synergistic or antagonistic |
|
|
when is it appropriate to using 99%? |
to be more conservative when you have ONE variable in regulatory climates stochastic variables result in 99% |
|
|
risk characterization step |
microbe 1 in 1,000 risk of INFECTION Chemicals 1 in a MILLION |
|
|
how can risk modeling assist in risk communications? |
inform public party of the correct dose response and different outcomes of a chemical or microbe |
|
|
HQ (Hazard Quotient) |
ratio of estimated dose and reference dose =intake/ RfD <1 is acceptable |
|
|
IELCR |
incremental excess lifetime cancer risk = cancer slope x lifetime average daily dose |
|
|
interval estimates |
range of values, probability distribution consideres uncertainty ad variability |
|
|
intrinsic heterogeneity |
differences in consumption cultural differences dose resonse sensitivity varies immune function |
|
|
Monte carlo |
most widely used tool for risk distribution analysis; combines distributions -variability assesment -uncertainty assessment -combination of both uses random number generator |
|
|
why use monte carlo? |
-combining distributions -draws randomly from two defined distributions -10,000 is recommended |