Reading...
![]()
Play button
![]()
Play button
![]()
Use LEFT and RIGHT arrow keys to navigate between flashcards;
Use UP and DOWN arrow keys to flip the card;
H to show hint;
A reads text to speech;
50 Cards in this Set
- Front
- Back
|
What causes the equilibrium quantity to fall?
|
supply and demand decrease
|
|
|
If the demand for a product decreases, then we would expect equilibrium price
|
and equilibrium quantity to both decrease
|
|
|
If the supply of a product increases, then we would expect equilibrium price
|
to decrease and equilibrium quantity to increase
|
|
|
If the supply of a product decreases, then we would expect equilibrium price
|
to increase and equilibrium quantity to decrease
|
|
|
When the price of a good is higher than the equilibrium price
|
sellers desire to produce and sell more than buyers wish to produce
|
|
|
If, at the current price, there is a surplus of a good, then
|
sellers are producing more than buyers with to buy
|
|
|
Suppose roses are currently selling for $40 per dozen, but the equilibrium price of roses is $30 per dozen. We would expect a
|
surplus and the market price of roses to decrease
|
|
|
A shortage exists in a market if
|
the current price is below its equilibrium price
|
|
|
If, at the current price, there is a shortage of a good, then
|
the price is below the equilibrium price
|
|
|
Suppose roses are currently $20 per dozen, but the equilibrium price of roses is $30 per dozen. We should expect a
|
shortage to exist and the market price of roses to increase
|
|

Refer to Figure 14-5.
Equilibrium price and quantity are, respectively |
$25 and 400 units
|
|
|
At the equilibrium price, the quantity of the good that buyers are willing and able to buy
|
exactly equals the quantity that sellers are willing and able to sell
|
|
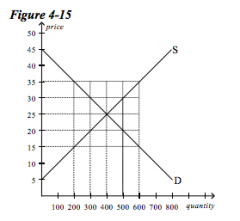
Refer to Figure 14-5.
At the equilibrium price, |
400 units would be supplied and demanded
|
|

Refer to Figure 14-5.
At a price of $35, there would be a |
surplus of 400 units
|
|
|
Refer to Figure 14-5.
At a price of $35, there would be |
excess supply, and the price would tend to fall from $35 to a lower price
|
|

Refer to Figure 14-5.
At what price would there be an excess supply of 200 units of the good? |
$30
|
|

Refer to Figure 14-5.
At a price of $15, there would be a |
shortage of 400 units
|
|

Refer to Figure 14-5.
At a price of $20, there would be a(n) |
excess demand. The law of supply and demand predicts that the price will rise from $20 to a higher price
|
|

Refer to Figure 14-5.
At what price would there be an excess demand of 200 units of the good? |
$20
|
|
|
What would happen to the equilibrium price and quantity of coffee if the wages of coffee-bean pickers fell and the price of tea fell
|
price would fall and the effect on quantity would be ambiguous
|
|
|
Beef is a normal good. You observe that both the equilibrium price and quantity of beef have fallen over time. What is the best explanation for this?
|
new medical evidence has been released that indicates a negative correlation between a person's beef consumption and life expectancy
|
|
|
What event could cause the price of oranges to fall?
|
the price of land throughout Florida decreases, and Florida produces a significant proportion of the nation's oranges
|
|
|
If macaroni and cheese is an inferior good, what would happen to the equilibrium price and quantity of macaroni and cheese if consumers' incomes rise?
|
both the equilibrium price and quantity would decrease
|
|
|
If consumers view cappuchinos and lattes as substitutes, what would happen to the equilibrium price and quantity of lattes if the price of cappuchinos rises?
|
both the equilibrium price and quantity would increase
|
|
|
What would happen to the equilibrium price and quantity of peanut butter if the price of peanuts went up, the price of jelly fell, fewer firms decided to produce peanut butter, and health officials announced that eating peanut butter was good for you
|
price will rise, and the effect on quantity is ambiguous
|
|

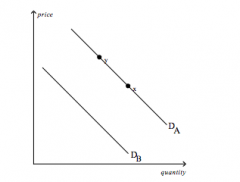
The diagram above pertain to the demand for turkey in the United States.
All else equal, an increase in the income of buyers who consider turkey to be an inferior good would cause a move from |
Demand curve A to Demand curve B
|
|

The diagram above pertain to the demand for turkey in the United States.
All else equal, a sale on chicken would cause a move from |
Demand curve A to Demand curve B
|
|

The diagram above pertain to the demand for turkey in the United States.
All else equal, the approach of Thanksgiving would cause a move from |
Demand curve B to Demand curve A
|
|

The diagram above pertain to the demand for turkey in the United States.
All else equal, buyers expecting turkey to be more expensive in the future would cause a current move from |
Demand curve B to Demand curve A
|
|

The diagram above pertain to the demand for turkey in the United States.
All else equal, a large number of people becoming vegetarians would cause a move from |
Demand Curve A to Demand Curve B
|
|
The diagram above pertain to the demand for turkey in the United States.
All else equal, the premature deaths of thousands of turkeys would cause a move from |
x to y
|
|

The diagram above pertain to the demand for turkey in the United States.
All else equal, an increase in the productivity of turkey farmers would cause a move from |
Demand Curve A to Demand Curve B
|
|

The diagram above pertain to the demand for turkey in the United States.
All else equal, a decrease in the price of the grain fed to turkeys would cause a move from |
y to x
|
|

The diagram above pertain to the demand for turkey in the United States.
All else equal, sellers expecting the price of turkey to rise in the future would cause a current move from |
x to y
|
|

The graph above pertains to the supply of paper to colleges and universities.
All else equal, an increase in the price of the pulp used in the paper production process would cause a move from |
Supply Curve B to Supply Curve A
|
|

The graph above pertains to the supply of paper to colleges and universities.
All else equal, sellers expecting the price of paper to decrease next month when many college students leave campuses for the summer would cause a current move from |
Supply Curve A to Supply Curve B
|
|

The graph above pertains to the supply of paper to colleges and universities.
All else equal, a major paper manufacturer filing for bankruptcy and shutting down as a result of an IRS tax evasion investigation would cause a move from |
Supply Curve B to Supply Curve A
|
|

The graph above pertains to the supply of paper to colleges and universities.
All else equal, an increase in the use of laptop computers for note-taking would cause a move from |
y to x
|
|
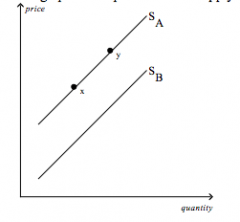
The graph above pertains to the supply of paper to colleges and universities.
All else equal, buyers expecting paper to be more expensive in the future would cause a current move from |
x to y
|
|
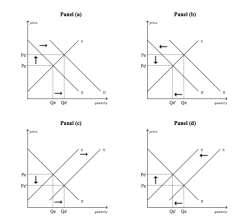
Refer to Figure 4-22
What does Panel (a) show? |
an increase in demand and an increase in quantity supplied
|
|

Refer to Figure 4-22
What does Panel (b) show? |
a decrease in demand and decrease in quantity supplied
|
|

Refer to Figure 4-22
What does Panel (c) show? |
an increase in quantity demanded and an increase in supply
|
|

Refer to Figure 4-22
What does Panel (d) show? |
a decrease in quantity demanded and a decrease in supply
|
|
|
Refer to Figure 4-22
Which of the four panels illustrates a decrease in quantity demanded? |
panel (d)
|
|

Refer to Figure 4-22
Which of the four panels illustrates an increase in quantity demanded? |
panel (c)
|
|

Refer to Figure 4-22
Which of the four panels illustrates a decrease in quantity supplied? |
panel (b)
|
|

Refer to Figure 4-22
Which of the four panels illustrates a increase in quantity supplied? |
panel (a)
|
|

Refer to Figure 4-22
Which of the four panels represent the market for pizza delivery in a college town as we go from summer to the beginning of the fall semester? |
panel (a)
|
|

Refer to Figure 4-22
Which of the four panels represents the market for winter coats as we progress from winter to spring? |
panel (b)
|
|

Refer to Figure 4-22
Which of the four panels represents the market for cars as a result of the adoption of new technology on assembly lines? |
panel (c)
|