![]()
![]()
![]()
Use LEFT and RIGHT arrow keys to navigate between flashcards;
Use UP and DOWN arrow keys to flip the card;
H to show hint;
A reads text to speech;
15 Cards in this Set
- Front
- Back
|
exposure? |
variable whose causal effect is to be estimated |
|
|
outcome? |
used to describe all possible results that may arise from exposure to a causal factor |
|
|
risk fact? |
attribute or exposure that is associated with an increased probability of a specified outcome. |
|
|
incidence risk ratio formula? RR=1 risk of the outcome in both exposed and non exposed groups are equal RR>1 then exposure increases the outcome risk RR<1 exposure reduces the outcome risk and exposure is said to be protective |
RE+ = a/(a + b) RE-= c/(c + d) RR = RE+/RE- estimate of how many times more likely exposed individuals are to experience the outcome of interest, compared with non-exposed exposed individuals |
|
|
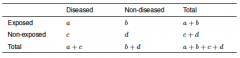
2 * 2 table |
|
|
|
limitations of incidence RR? |
can't be estimated in caste control studies because these studies don't allow us to calculate risks |
|
|
incidence rate ratio? |
the ratio of the incidence rate in the exposed group to that in the non-exposed group. interpreted that same way as Incident RR. |
|
|
relative risk? |
synonym for incidence risk ratio and incidence rate ratio |
|
|
odds ratio - cohort studies exposure positive/negative come first, then subjects are followed over time to determine their outcome status (outcome positive, outcome negative) |
OE+ = a/b OE- = c/d odd ratio = OE+ / OE- or AD/BC note: odds ratio provides a very close estimate of the incidence risk ratio |
|
|
odds ratio - case-control studies (disease positive, disease negative) is defined first. the history provided by each study subject then provides information about exposure status. |
OD+ = a/c OD- = b/d OR = OD+/OD- |
|
|
cohort studies vs case control studies |
in a cohort study we talking about the odds of disease being x times greater (or less) in the exposed, compared with the unexposed. In a case control study we talk about the odds of exposure being X times greater (or less) in cases compared with controls. |
|
|
Attributable risk (or rate) |
defined as the increase/decrease in the risk/rate of the outcome in the exposed group that is attributable to exposure AR = (RE+) - (RE-) aka attributable risk reduction or attributable risk increase in the exposure group |
|
|
(NNT) |
number needed to treat is a useful way of expressing attributable risk. The NNT is the number of subjects who would have to be given the exposure treatment to prevent a negative outcome from occuring. avoid expressing attributable risk or rate estimates as percentage because they are too easily misinterpreted |
|
|
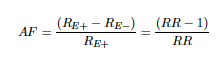
attributable fraction AKA the attributable proportion in the exposed, is the proportion of outcome positive subjects in the exposed group that is due to exposure |
|
|
|
Front (Term) |
Summary |