![]()
![]()
![]()
Use LEFT and RIGHT arrow keys to navigate between flashcards;
Use UP and DOWN arrow keys to flip the card;
H to show hint;
A reads text to speech;
10 Cards in this Set
- Front
- Back
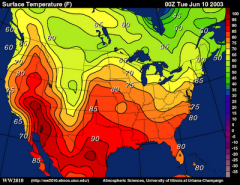
isoline |
changes in the variable being mapped across a surface by lines that connect equal points of value |
|
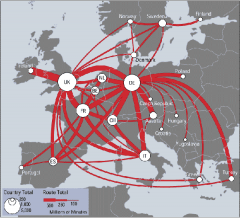
flowline |
shows the quantities of something by varying the size of the symbols |
|
repetitive-symbol |
a map that uses repetitive dots or other repetitive symbols that present 3 logically different ideas i. actual position of things ii. spatial arrangement of things iii. general impression of things |
|
|
temporal-trend |
shows how geographic patterns change through time |
|
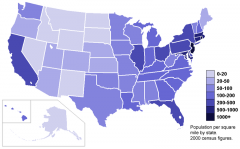
choropleth |
maps the level of some variable within predefined regions, like countries, cities, and states. Puts variables into classes and depicts each class with different shading patterns or colors |
|
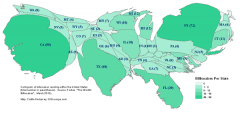
cartogram |
map line object that shows quantities by distorting the sizes of familiar areas. Can offer a visual surprise! |
|
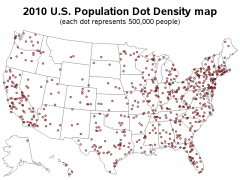
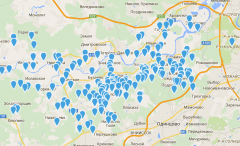
dot |
uses a dot to represent the occurrence of some variable in order to depict variation of density in a given area |
|
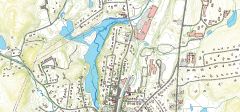
planimetric |
shows the location of a selected number of features precisely and exaggerates the size of things that are of interest |
|
|
proportional-symbol |
uses a symbol, like a circle to show intensity of frequency, where the size of the symbol varies with frequency or the size of the mapped variable |
|
|
point-symbol |
uses a dot to map phenomena that are discrete and are often used in elementary textbooks |